How Do You Create Budgets and Forecast Cash Flow Without Spreadsheet Chaos?
Complete financial planning and analysis from budgeting to forecasting. Create departmental budgets with approval workflows, track actual spending versus budget in real-time, forecast cash flow based on receivables and payables, analyze financial ratios and KPIs, generate custom financial reports, and compare performance across periods and departments in one system that eliminates budget spreadsheets and outdated financial forecasts.
Most businesses manage financial planning using disconnected budget spreadsheets, manual variance analysis, static cash flow forecasts, and financial reports built from data exported monthly from accounting systems. Budgets become outdated immediately, actual versus budget comparisons require manual consolidation from multiple departments, cash flow forecasting relies on guesswork, and financial analysis uses stale data. Alpide Financial Management connects directly with accounting, sales, purchasing, and operations data. Budgets track against actual transactions in real-time, cash flow forecasts update automatically from receivables and payables, financial ratios calculate from current data, and custom reports generate instantly without exporting data—eliminating budget spreadsheet chaos, providing accurate cash flow visibility, and enabling real-time financial analysis instead of outdated monthly reporting.
Complete Financial Planning & Analysis System
Create budgets by department, project, or cost center with approval workflows. Track actual spending versus budget in real-time with variance analysis. Forecast cash flow based on accounts receivable, accounts payable, and committed purchase orders. Analyze financial ratios including gross margin, operating margin, current ratio, and debt-to-equity. Generate custom financial reports with drill-down to transaction detail. Compare financial performance across time periods, departments, and locations. Real-time financial data from operations eliminates manual data consolidation and provides current visibility for better financial decisions.
Integrated Financial Data
Financial reports pull data automatically from general ledger, accounts payable, accounts receivable, inventory, sales orders, and purchase orders without manual export and consolidation. Budget versus actual comparisons update in real-time as transactions occur. Cash flow forecasts incorporate current receivables and payables. Financial ratios calculate from live operational data. Integrated financial data eliminates manual data gathering and ensures financial reports reflect current business performance.
Custom Financial Reports
Build custom financial reports using drag-and-drop report designer. Select dimensions including time period, department, cost center, project, or location. Choose metrics like revenue, expenses, gross margin, or custom KPIs. Drill down from summary to transaction detail. Schedule automated report delivery to stakeholders. Export to Excel or PDF. Custom reporting provides exactly the financial visibility needed without IT involvement or waiting for IT report requests.

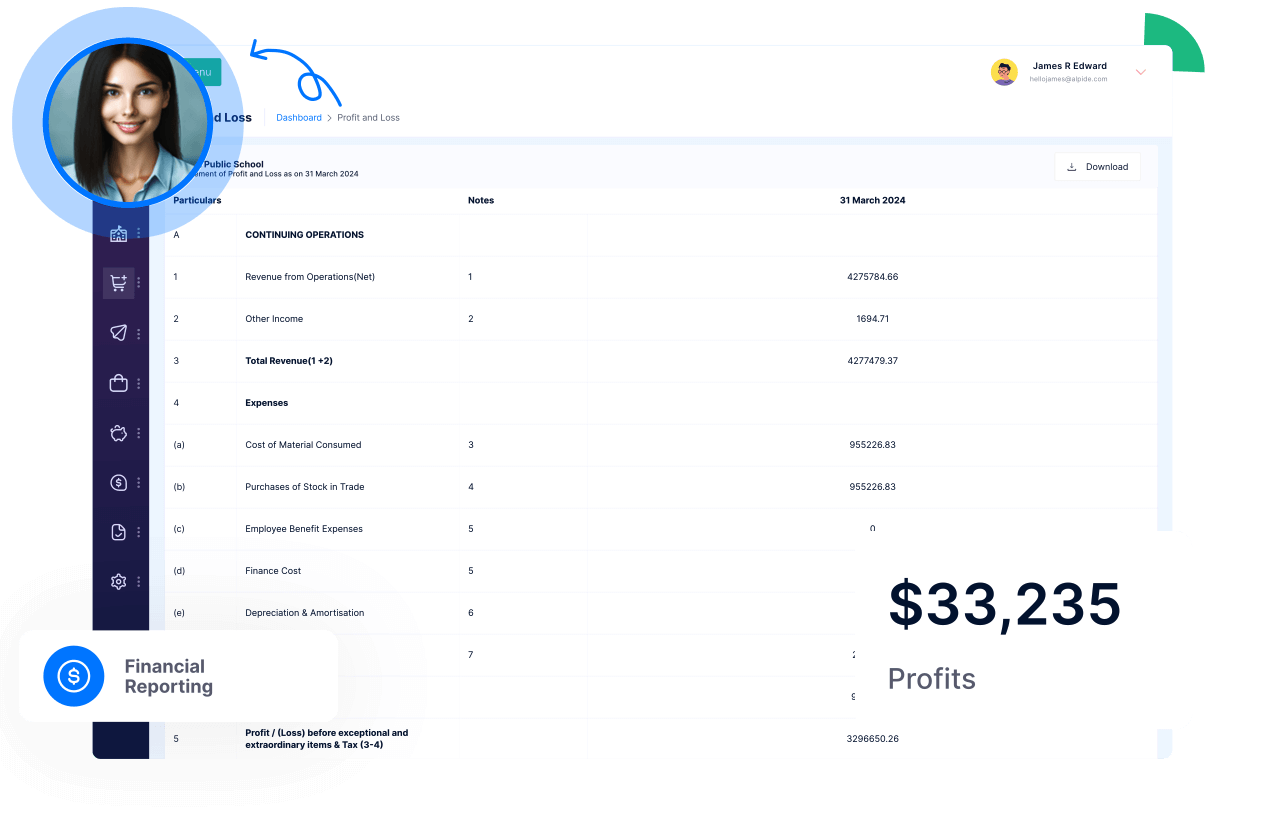
Custom Financial Reporting
Generate financial reports customized to business needs including income statements by department, balance sheets with prior period comparisons, cash flow statements, profit and loss by product line or location, budget versus actual variance reports, and financial ratio analysis. Save custom report templates for regular use. Schedule automated monthly or quarterly report delivery to executives and board members.
Income Statements
Generate income statements showing revenue, cost of goods sold, gross profit, operating expenses, and net income for any time period. Compare current period to prior periods or budget. Break down by department, location, or business unit. Drill down to transaction detail from summary lines.
Cash Flow Statements
Cash flow statements show cash inflows from operations, investing activities, and financing activities. Track cash from receivables, cash paid to vendors, capital expenditures, and loan proceeds. Forecast future cash flow based on current receivables due dates and payables payment terms. Monitor cash position to prevent cash shortages.
Profit & Loss Reports
Profit and loss reports analyze profitability by product, customer, department, or project. Identify which products or customers generate highest margins. Track profit trends over time. Compare profit across departments or locations. Profitability analysis guides pricing, product mix, and customer focus decisions.
Financial Forecasts
Create financial forecasts based on historical trends, growth assumptions, and pipeline data. Forecast revenue from sales pipeline and historical seasonality. Forecast expenses based on committed costs and variable cost assumptions. Project cash flow from forecasted revenue and expenses. Multiple scenario forecasting models best-case, expected, and worst-case outcomes.
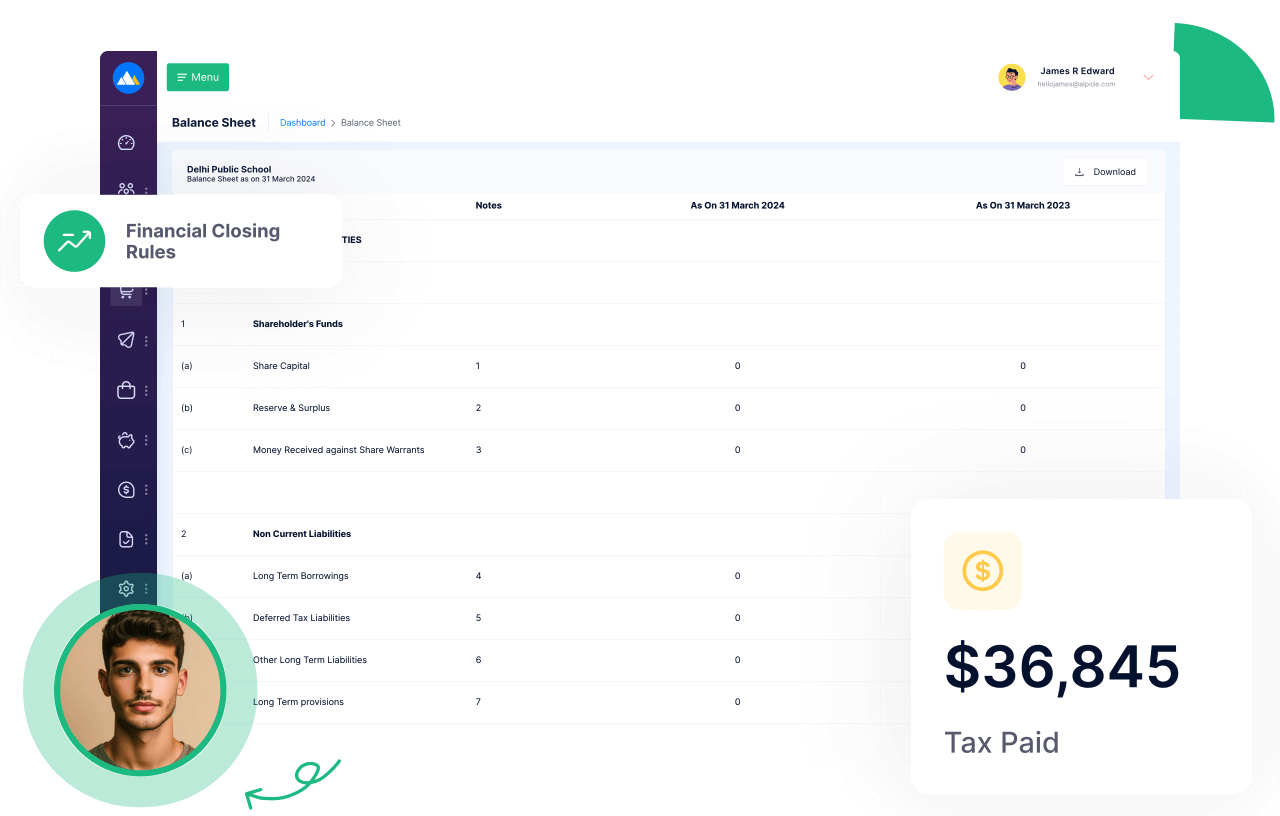
Financial Closing Rules
Configure period-end closing processes with automated workflows and validation rules. System guides financial closing with checklist of required tasks. Lock closed periods to prevent changes. Define closing journal entries that post automatically. Set validation rules to ensure all transactions are properly recorded before closing period. Standardized closing process reduces month-end time and ensures consistency.
Analyze Balance Sheets
Balance sheet shows assets, liabilities, and equity at period end. Compare current balance sheet to prior periods to identify changes. Analyze liquidity with current ratio and quick ratio. Monitor debt levels with debt-to-equity ratio. Balance sheet analysis provides snapshot of financial position for investors and lenders.
Tax Reports
Generate tax reports including sales tax collected and paid, income tax provision calculations, and compliance reports for regulatory filings. Track tax obligations by jurisdiction. Calculate estimated tax payments quarterly. Export tax data for accountants and tax preparers. Tax reporting ensures compliance and accurate tax filing.
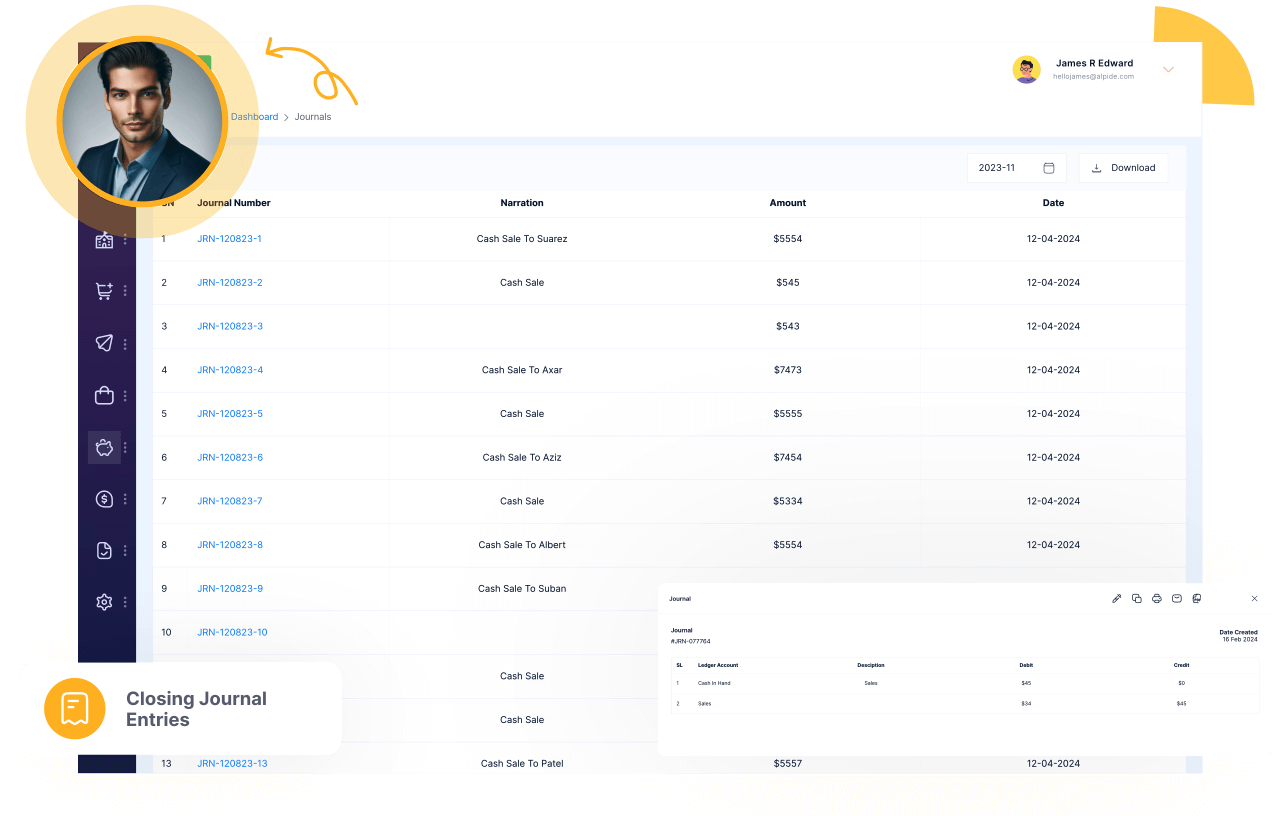
Closing Journal Entries
Automate period-end closing journal entries including accruals, deferrals, depreciation, and reclassifications. Define closing entry templates that post automatically during financial closing. Review and approve closing entries before finalizing. Complete audit trail tracks all closing entries. Automated closing entries reduce manual effort and ensure consistent period-end accounting treatment.
Track Budgeting
Create budgets by department, cost center, or project with detailed line items for revenue and expense categories. Route budgets through approval workflows. Lock approved budgets to prevent unauthorized changes. Allocate annual budgets to monthly or quarterly periods. Budget tracking provides spending targets and accountability for department managers.
Analyze Financial Ratios
Calculate financial ratios automatically including gross margin percentage, operating margin, return on assets, current ratio, quick ratio, debt-to-equity, and inventory turnover. Track ratio trends over time. Compare ratios to industry benchmarks. Financial ratio analysis identifies strengths, weaknesses, and areas requiring management attention.
Benefits of Financial Management

Investor
Confidence
Detailed reports enhance investor trust by demonstrating transparency and fiscal responsibility.

Compliance and
Regulation Adherence
Regular financial reporting ensures compliance with legal and regulatory requirements, avoiding potential legal issues.

Performance
Analysis
It allows for a thorough analysis of financial performance, identifying trends, strengths, and areas needing improvement.
Budget
Management
Helps in effective budget planning and monitoring, ensuring financial resources are used efficiently.
Stakeholder
Communication
Improves communication with stakeholders by providing a clear picture of the company's financial health.
Credit
Management
Assists in managing credit effectively by keeping track of earnings, expenditures, and overall financial stability.
Why Unified Financial Planning Beats Standalone Budgeting Tools
Traditional businesses use standalone budgeting software or budget spreadsheets disconnected from operational systems and accounting. Creating budgets requires exporting data from accounting, analyzing in spreadsheets, then uploading back to budgeting software. Budget versus actual comparisons require monthly data exports and manual consolidation. Cash flow forecasting relies on static snapshots of receivables and payables. Financial reports pull from accounting exports that are outdated immediately. Alpide Financial Management connects directly with general ledger, accounts payable, accounts receivable, sales orders, purchase orders, and inventory in one unified platform. Budgets track against live transactions automatically. Cash flow forecasts update from current receivables and payables without export. Financial ratios calculate from real-time operational data. You eliminate budget spreadsheet maintenance, stop exporting accounting data monthly for analysis, and end the frustration of outdated financial reports. One system where financial planning flows from current operational data automatically.
Common Financial Planning Scenarios Where Alpide Helps
Real-world challenges solved with unified financial planning platform.
Creating departmental budgets with approval workflows
Department managers create budget requests using historical spending data and growth assumptions. Budgets route through approval hierarchy to finance team and executives. Reviewers compare requested budgets to prior year actuals and company targets. Approved budgets lock to prevent unauthorized changes. Budget approval workflow ensures proper oversight and alignment with company financial targets before budget year begins.
Tracking actual spending versus budget in real-time
Budget versus actual reports show spending compared to budget by department and expense category. Real-time variance alerts notify managers when spending approaches or exceeds budget. Monthly variance reports identify departments over or under budget with explanations. Year-to-date tracking shows cumulative budget performance. Real-time budget tracking enables proactive spending management instead of discovering problems at year-end.
Forecasting cash flow to prevent cash shortages
Cash flow forecasts project cash receipts from accounts receivable due dates and expected payment timing. Project cash payments from accounts payable due dates and committed purchase orders. Factor in loan payments, payroll, and other recurring expenses. Forecast shows daily, weekly, or monthly cash position. Early warning of cash shortages enables proactive financing arrangements or expense management.
Analyzing profitability by product, customer, or department
Profit and loss reports break down revenue, cost of goods sold, and gross margin by product category or SKU. Analyze customer profitability including revenue, discounts, cost of goods sold, and fulfillment costs. Department P&L shows revenue generated and expenses incurred by each department. Profitability analysis identifies high-margin products to promote and low-margin areas requiring attention.
Comparing financial performance across multiple time periods
Comparative financial reports show current month versus prior month, current quarter versus prior quarter, and current year versus prior year. Calculate growth rates and variance percentages automatically. Trend reports show revenue, expenses, and profit trends over 12 or 24 months. Multi-period comparisons identify seasonal patterns, growth trends, and performance changes requiring investigation.
Frequently Asked Questions
Can we create budgets by department, project, or cost center?
Yes. Define budget dimensions including department, cost center, project, location, or custom categories. Allocate company budget to departments, then departments allocate to projects or cost centers. Track budget at multiple levels simultaneously. Roll up lower-level budgets to department or company totals automatically. Multi-dimensional budgeting provides detailed budget accountability while enabling consolidated budget views for executives.
How does cash flow forecasting help prevent cash shortages?
Cash flow forecasts project receipts from accounts receivable due dates and historical collection patterns. Project payments from accounts payable due dates and payment terms. Include recurring expenses like payroll, rent, and loan payments. Forecast shows projected daily, weekly, or monthly cash balance. Negative cash projections provide early warning to arrange financing, accelerate collections, or delay payments preventing cash crises.
Can we analyze profitability by product, customer, or sales channel?
Yes. Profit and loss reports segment by product category, individual SKU, customer, customer segment, sales channel, or region. Calculate revenue, cost of goods sold, gross margin, allocated operating expenses, and net profit per segment. Identify most and least profitable products, customers, and channels. Profitability segmentation guides product pricing, customer focus, marketing spend, and resource allocation decisions.
How do we compare financial performance across multiple time periods?
Comparative reports show current period versus prior period with dollar and percentage variances. Compare current month to prior month, current quarter to same quarter last year, or year-to-date current year to prior year. Trend reports show 12 or 24 months of data with charts. Multi-year comparisons identify long-term growth patterns. Period comparisons reveal seasonal patterns, growth trends, and performance changes.
Can we set up approval workflows for budget submissions?
Yes. Configure budget approval hierarchies where department managers submit budgets to directors, directors submit to executives, and executives approve final budgets. Reviewers compare submitted budgets to prior year actuals and company targets. Approvers can approve, reject, or request revisions. Audit trail tracks all budget submissions and approvals. Workflow ensures proper budget oversight before finalizing annual budgets.
What financial ratios can we track automatically?
System calculates financial ratios automatically including gross margin percentage, operating margin, net profit margin, return on assets, return on equity, current ratio, quick ratio, debt-to-equity ratio, inventory turnover, and days sales outstanding. Track ratio trends over time with charts. Compare ratios to industry benchmarks. Financial ratio dashboards provide quick health checks on profitability, liquidity, efficiency, and leverage.
Can we generate consolidated financial reports for multiple entities?
Yes. Maintain separate financials for each subsidiary, location, or business unit. Generate individual financial statements per entity. Multi-entity consolidation combines financials from all entities into consolidated reports. Eliminate intercompany transactions automatically. Comparative reports show performance across entities. Multi-entity financial reporting supports businesses with multiple companies, franchises, or geographic operations requiring both individual and consolidated reporting.
How do we create custom financial reports without IT help?
Drag-and-drop report designer allows users to create custom reports without programming. Select dimensions like time period, department, cost center, or project. Choose metrics including revenue, expenses, gross margin, or custom KPIs. Format reports with headers, footers, and subtotals. Save templates for recurring reports. Schedule automated delivery. Self-service reporting eliminates waiting for IT to build requested reports.
How is Alpide Financial Management different from standalone FP&A tools like Adaptive Insights or Planful?
Adaptive Insights and Planful are powerful financial planning platforms but require integration with ERP, accounting, and operational systems. Alpide Financial Management integrates natively with general ledger, accounts payable, accounts receivable, sales, purchasing, and inventory in one unified platform. For growing businesses needing financial planning plus complete operations management, Alpide eliminates integration complexity, provides real-time operational data for planning, and costs substantially less.
Related Questions About Financial Planning & Analysis Software
Do we need separate budgeting software or can ERP handle it?
Alpide includes integrated budgeting and financial planning eliminating need for separate budgeting software. Budgets connect directly to accounting actuals for real-time variance tracking without export and import. For businesses committed to standalone budgeting tools, integration is possible but adds complexity. Integrated budgeting and accounting in one system provides better real-time visibility.
How often should we update financial forecasts?
Best practice is rolling forecasts updated quarterly or monthly rather than annual static forecasts. Update revenue forecasts when pipeline changes significantly. Update expense forecasts when major cost changes occur. Update cash flow forecasts weekly or bi-weekly in cash-constrained situations. Frequent forecast updates based on actual performance provide better visibility than outdated annual forecasts.
Can financial planning software integrate with our existing accounting system?
Alpide includes integrated accounting and financial planning in one system eliminating integration needs. For businesses using existing accounting systems, work with Alpide team to discuss integration options. Unified accounting and financial planning provides real-time budget versus actual tracking without manual data exports or integration tools connecting separate systems.
What's the ROI of implementing financial planning software?
Typical ROI includes better cash management from accurate cash flow forecasts reducing borrowing costs, improved profitability from data-driven resource allocation decisions, reduced budget cycle time from automated workflows, eliminated spreadsheet errors causing bad decisions, and faster financial reporting enabling quicker course corrections. Most organizations achieve payback within 6-12 months from better financial decisions alone.
Alpide blog
Boost Your Business with Alpide! Expert insights on ERP, E-Commerce, CRM, Warehouse, Accounting, HR, Sales, Finance & more to fuel your growth.

Talk to Expert
Transform Your Business With Alpide
Streamline your business operations, access real-time insights, enhance control, ensure data accuracy, lower expenses, fulfill orders efficiently, and elevate customer service with.


Contact Us